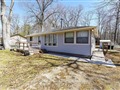
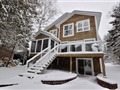
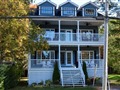
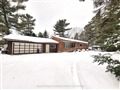
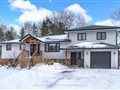
11 Maplewood Dr
$674,056
Comparative Market Analysis
Apr 11, 2025
NOT AN ACTIVE LISTING
Historical Performance
| Period | $ Change | % Change |
| 1 Day | +$237 | +0.035% |
| 7 Days | +$221 | +0.033% |
| 30 Days | -$1,158 | -0.172% |
| 3 Months | -$2,641 | -0.390% |
| 6 Months | +$8,988 | +1.35% |
| 1 Year | -$35.1k | -4.94% |
| 3 Years | +$131k | +24.1% |
| 5 Years | +$243k | +56.3% |
| 10 Years | +$444k | +193% |
List My Property
Real Estate Statistics
Financing Solutions
AS SEEN ON


Are You a Licensed Real Estate Agent or Broker?